“WEC11 01 que 20190109”的版本间的差异
跳到导航
跳到搜索
【点此返回历年真题目录】
(→题目解答) |
|||
| 第104行: | 第104行: | ||
|- | |- | ||
| align="right" valign="top" width="100px" |'''文字版备查''' || || <small>The table shows the estimated income elasticity of demand for various goods and services in the USA. Which one of the following can be deduced from the table? A Cheese has relatively price inelastic demand. B Public transport is a normal good. C An increase in real income will result in a less than proportionate decrease in demand for ice cream. D A decrease in real income will result in a more than proportionate decrease in the demand for motor cars.</small> | | align="right" valign="top" width="100px" |'''文字版备查''' || || <small>The table shows the estimated income elasticity of demand for various goods and services in the USA. Which one of the following can be deduced from the table? A Cheese has relatively price inelastic demand. B Public transport is a normal good. C An increase in real income will result in a less than proportionate decrease in demand for ice cream. D A decrease in real income will result in a more than proportionate decrease in the demand for motor cars.</small> | ||
|} | |||
<br/> | |||
==7== | |||
{| | |||
|- | |||
| align="right" valign="top" |'''题目'''|| || style="background: #FAF0E6"| [[File:EdxAL_2019_01_P1_07_1.png|700px]] | |||
|- | |||
| align="right" |'''题目类型'''|| || '''画图题''' | |||
|- | |||
| align="right" valign="top" |'''难度''' || || {{Background color|#FFC20E|''' 中等 '''}} | |||
|- | |||
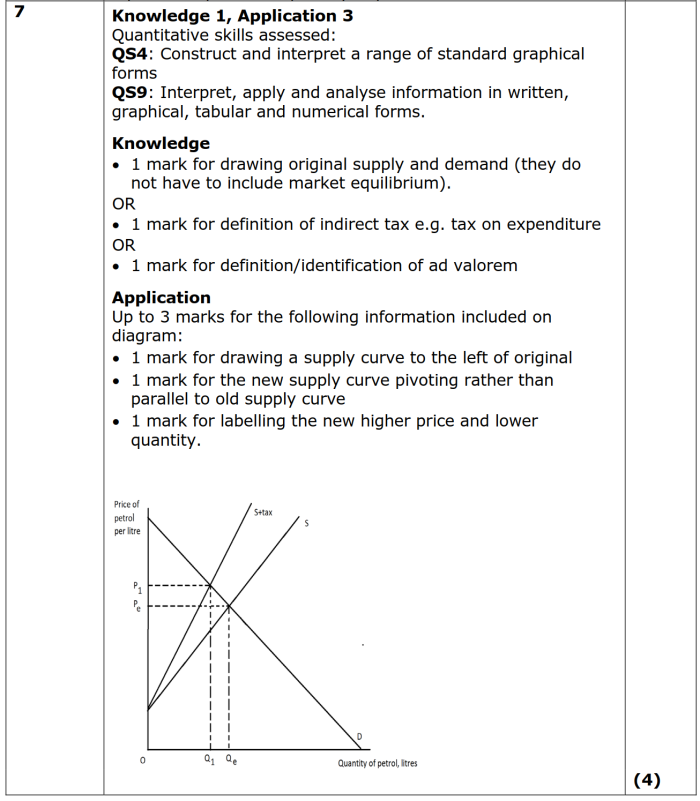
| align="right" valign="top" |'''考察知识点'''|| || ad valorem tax的图像及均衡点变化情况 | |||
|- | |||
| align="right" valign="top" width="100px" |'''解答要点'''|| || ● 注意材料中描述的税收是按照价格百分比收的,因此判定属于ad valorem tax,画图时需要呈现“喇叭口”形状才能得分。 | |||
|- | |||
| align="right" valign="top" |'''官方答案'''|| || style="background: #d3d3d3"| <blockquote><span style="font-size:16px"><span style="Times New Roman"> | |||
<center>[[File:EdxAL_2019_01_P1_07_1.png|700px]]</center> | |||
The supply curve pivots leftwards from S0 to S1 because of the introduction of an ad valorem tax in Saudi Arabia. {{color|red|(根据题目要求回答问题→)}}Equilibrium price increases from P0 to P1. Equilibrium quantity decreases from Q0 to Q1. | |||
</span></span></blockquote> | |||
|- | |||
| align="right" valign="top" |'''参考例文'''|| || style="background: #d3d3d3"| [[File:EdxAL_2019_01_P1_07_2.png|700px]] | |||
|- | |||
| align="right" valign="top" |'''文字版备查'''|| ||<small>Saudi Arabia introduced its first indirect tax on the sale of goods and services in 2018. The tax is charged at 5% of the price of goods and services. Draw a diagram to illustrate the impact of the introduction of the indirect tax on the equilibrium price and quantity of petrol in Saudi Arabia.</small> | |||
|} | |} | ||
<br/> | <br/> | ||
2023年1月30日 (一) 23:18的版本
单题搜索方法:右上角搜索中输入该题中的部分文字,点击搜索后进入相关页面,然后使用ctrl+F5(或其他按键组合调出搜索框),再次搜索该题干文字,直接定位到题目。
整卷下载
- 试卷请点击此处 ⇒ 【2019 冬季 U1】
- 答案请点击此处 ⇒ 【2019 冬季 U1 mark scheme】
题目解答
1
2
3
4
5
| 题目 | 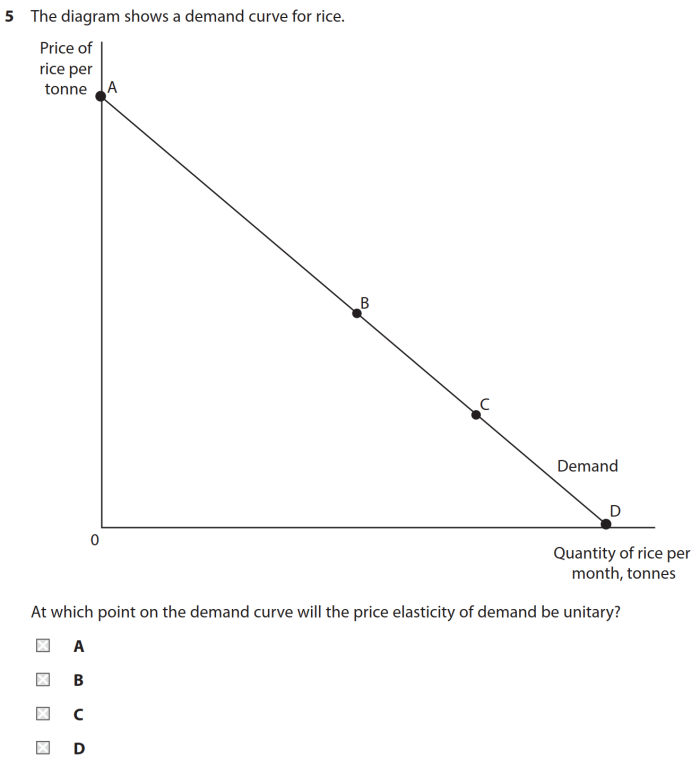
| |
| 答案 | B | |
| 难度 | 容易 | |
| 考察知识点 | Demand线上各点的PED值 | |
| 解答要点 | ● 单位弹性位于D线的中点位置,因此B选项正确。 | |
| 文字版备查 | The diagram shows a demand curve for rice. At which point on the demand curve will the price elasticity of demand be unitary? |
6
7
