“CAIE IG revision - Section 2 (2018)”的版本间的差异
| (未显示同一用户的9个中间版本) | |||
| 第138行: | 第138行: | ||
*Supply curve表示的是price价格与quantity supplied供给量之间呈正比的关系。 | *Supply curve表示的是price价格与quantity supplied供给量之间呈正比的关系。 | ||
*普通的supply curve如下图所示:(横轴是quantity,纵轴是price,题目中没要求数字的时候可以画成没有数据的示意图。) | *普通的supply curve如下图所示:(横轴是quantity,纵轴是price,题目中没要求数字的时候可以画成没有数据的示意图。) | ||
<center>[[File: CAIE2023-2.1.6-1.png | | <center>[[File: CAIE2023-2.1.6-1.png |400px]] </center> | ||
<br/> | <br/> | ||
| 第161行: | 第161行: | ||
**Supply curve发生movement点移动的唯一原因是本商品的price发生了变化。Price上升会导致quantity supplied上升,反之同理。 | **Supply curve发生movement点移动的唯一原因是本商品的price发生了变化。Price上升会导致quantity supplied上升,反之同理。 | ||
**Movement点移动时,量的增加称为extension,量的下降称为contraction。 | **Movement点移动时,量的增加称为extension,量的下降称为contraction。 | ||
<center>[[File: CAIE2023-2.1.7-3.png | | <center>[[File: CAIE2023-2.1.7-3.png |400px]] </center> | ||
<br/> | <br/> | ||
*Shift线移动 | *Shift线移动 | ||
**除了price因素之外的其他影响因素(即Non-price factors非价格因素)都会导致Supply curve发生shift型移动。【参考1.1.3(f)】 | **除了price因素之外的其他影响因素(即Non-price factors非价格因素)都会导致Supply curve发生shift型移动。【参考1.1.3(f)】 | ||
**Supply curve左移shift leftwards表示供给下降(左图所示),右移shift rightwards表示供给上升(右图所示)。 | **Supply curve左移shift leftwards表示供给下降(左图所示),右移shift rightwards表示供给上升(右图所示)。 | ||
<center>[[File: CAIE2023-2.1.6-2.png | | <center>[[File: CAIE2023-2.1.6-2.png |400px]] [[File: CAIE2023-2.1.6-3.png |400px]] </center> | ||
<br/> | <br/> | ||
*影响supply curve发生shift移动的原因: | *影响supply curve发生shift移动的原因: | ||
| 第203行: | 第203行: | ||
**市场均衡时的价格叫equilibrium price,需求量/供给量叫equilibrium quantity。此时,称为市场出清market clears。 | **市场均衡时的价格叫equilibrium price,需求量/供给量叫equilibrium quantity。此时,称为市场出清market clears。 | ||
**Market equilibrium常见图像: | **Market equilibrium常见图像: | ||
<center>[[File: CAIE2023-2.4.1-1.png | | <center>[[File: CAIE2023-2.4.1-1.png |400px]] </center> | ||
<br/> | <br/> | ||
| 第215行: | 第215行: | ||
***如果市场正常运转,价格将上涨到均衡价格,此时quantity supplied增加,quantity demanded减少,因此shortage消失。 | ***如果市场正常运转,价格将上涨到均衡价格,此时quantity supplied增加,quantity demanded减少,因此shortage消失。 | ||
***Excess demand常见图像: | ***Excess demand常见图像: | ||
<center>[[File: CAIE2023-2.4.1-2.png | | <center>[[File: CAIE2023-2.4.1-2.png |400px]] </center> | ||
<br/> | <br/> | ||
**Excess supply:超额供给(价格偏高)。在当前价格下,供给量高于需求量。 | **Excess supply:超额供给(价格偏高)。在当前价格下,供给量高于需求量。 | ||
| 第221行: | 第221行: | ||
***如果市场正常运转,价格将下跌到均衡价格,此时quantity supplied减少,quantity demanded增加,因此surplus消失。 | ***如果市场正常运转,价格将下跌到均衡价格,此时quantity supplied减少,quantity demanded增加,因此surplus消失。 | ||
***Excess supply常见图像: | ***Excess supply常见图像: | ||
<center>[[File: CAIE2023-2.4.1-3.png | | <center>[[File: CAIE2023-2.4.1-3.png |400px]] </center> | ||
<br/> | <br/> | ||
*注意(评价):完全交给市场调节,可能有以下问题: | *注意(评价):完全交给市场调节,可能有以下问题: | ||
| 第247行: | 第247行: | ||
*Demand curve与supply curve线移动shift的原因可【参考1.1.3(c)和1.1.3(f)】。 | *Demand curve与supply curve线移动shift的原因可【参考1.1.3(c)和1.1.3(f)】。 | ||
*Demand curve与supply curve线移动shift后,均衡点发生变化,相应的equilibrium price和equilibrium quantity也会跟着发生变动。(如下图所示) | *Demand curve与supply curve线移动shift后,均衡点发生变化,相应的equilibrium price和equilibrium quantity也会跟着发生变动。(如下图所示) | ||
<center>[[File: CAIE2023-2.4.2-1.png | | <center>[[File: CAIE2023-2.4.2-1.png |450px]] </center> | ||
<br/> | <br/> | ||
**注意:考试时画完图像后,需要对图像进行解释和描述。文字部分主要围绕shift线移动的原因、移动方向、均衡价格和均衡数量的变化情况来进行描述。 | **注意:考试时画完图像后,需要对图像进行解释和描述。文字部分主要围绕shift线移动的原因、移动方向、均衡价格和均衡数量的变化情况来进行描述。 | ||
| 第289行: | 第289行: | ||
*完整Demand curve上的弹性变化: | *完整Demand curve上的弹性变化: | ||
<center>[[File: CAIE2023-2.2.5-1.png | | <center>[[File: CAIE2023-2.2.5-1.png |400px]] </center> | ||
<br/> | <br/> | ||
**在完整的Demand curve中,弹性的数值随着需求量的增加而不断下降,从偏elastic到偏inelastic。(注意区分本完整图与上表中的分段图像。) | **在完整的Demand curve中,弹性的数值随着需求量的增加而不断下降,从偏elastic到偏inelastic。(注意区分本完整图与上表中的分段图像。) | ||
| 第295行: | 第295行: | ||
**特别注意:弹性与直线的斜率不是同一个概念,不要混淆。 | **特别注意:弹性与直线的斜率不是同一个概念,不要混淆。 | ||
<br/> | <br/> | ||
===2.7.3 determinants of PED PED的影响因素=== | ===2.7.3 determinants of PED PED的影响因素=== | ||
{{color|grey| | {{color|grey| | ||
| 第521行: | 第522行: | ||
*Failure to take into account all costs and benefits 没有考虑全部的收益和成本 | *Failure to take into account all costs and benefits 没有考虑全部的收益和成本 | ||
**Negative externality:负外部性,指给第三方带来负面的影响。由于企业不会考虑该类负面影响,因此产出偏多,存在over-production的问题。如下图所示: | **Negative externality:负外部性,指给第三方带来负面的影响。由于企业不会考虑该类负面影响,因此产出偏多,存在over-production的问题。如下图所示: | ||
<center>[[File: CAIE2023-7.4.5-5.png | | <center>[[File: CAIE2023-7.4.5-5.png |350px]] </center> | ||
<br/> | <br/> | ||
***上图中,S线为企业仅考虑自身成本的supply curve,Sx线为政府考虑了所有成本的supply curve。按照企业的情况,市场会在Q处进行生产。而按照政府的情况,市场应该在Qx处进行生产。因此,当负外部性存在时,企业会over-produced过度生产。 | ***上图中,S线为企业仅考虑自身成本的supply curve,Sx线为政府考虑了所有成本的supply curve。按照企业的情况,市场会在Q处进行生产。而按照政府的情况,市场应该在Qx处进行生产。因此,当负外部性存在时,企业会over-produced过度生产。 | ||
**Positive externality:正外部性,指给第三方带来正面的影响。由于消费者不会考虑该类正面影响,因此消费偏少,存在under-consumption的问题。如下图所示: | **Positive externality:正外部性,指给第三方带来正面的影响。由于消费者不会考虑该类正面影响,因此消费偏少,存在under-consumption的问题。如下图所示: | ||
<center>[[File: CAIE2023-7.4.5-6.png | | <center>[[File: CAIE2023-7.4.5-6.png |350px]] </center> | ||
<br/> | <br/> | ||
***上图中,D线为消费者仅考虑自身利益的demand curve,Dx线为政府考虑了所有收益的demand curve。按照消费者的情况,市场会在Q处进行消费。而按照政府的情况,市场应该在Qx处进行消费。因此,当正外部性存在时,消费者会under-consumed消费不足。 | ***上图中,D线为消费者仅考虑自身利益的demand curve,Dx线为政府考虑了所有收益的demand curve。按照消费者的情况,市场会在Q处进行消费。而按照政府的情况,市场应该在Qx处进行消费。因此,当正外部性存在时,消费者会under-consumed消费不足。 | ||
| 第541行: | 第542行: | ||
**一些企业只注重眼前利益而没有关注长期利益,导致生产不可持续,后续投资减少,环境受到破坏。 | **一些企业只注重眼前利益而没有关注长期利益,导致生产不可持续,后续投资减少,环境受到破坏。 | ||
<br/> | <br/> | ||
===2.10.3 consequences of market failure 市场失灵的影响=== | ===2.10.3 consequences of market failure 市场失灵的影响=== | ||
{{color|grey| | {{color|grey| | ||
| 第559行: | 第561行: | ||
**世界上绝大多数国家都实行的是mixed economy。 | **世界上绝大多数国家都实行的是mixed economy。 | ||
**常见的一些国家处于mixed economy中的位置: | **常见的一些国家处于mixed economy中的位置: | ||
<center>[[File: CAIE2023-1.4.1-1.png | | <center>[[File: CAIE2023-1.4.1-1.png |900px]] </center> | ||
<br/> | <br/> | ||
*Mixed economy混合经济对市场经济的改进: | *Mixed economy混合经济对市场经济的改进: | ||
| 第571行: | 第573行: | ||
**Government can help vulnerable groups, ensuring that they have access to basic necessities. 政府会帮助社会中的弱势群体,保证其生存基本条件 | **Government can help vulnerable groups, ensuring that they have access to basic necessities. 政府会帮助社会中的弱势群体,保证其生存基本条件 | ||
<br/> | <br/> | ||
===2.11.2 government intervention to address market failure 政府干预以解决市场失灵=== | ===2.11.2 government intervention to address market failure 政府干预以解决市场失灵=== | ||
{{color|grey| | {{color|grey| | ||
| 第579行: | 第582行: | ||
*Maximum price:最高价格管控。政府设定的最高价格要低于市场均衡价格,以压低商品的价格,增加需求量。 | *Maximum price:最高价格管控。政府设定的最高价格要低于市场均衡价格,以压低商品的价格,增加需求量。 | ||
**有效的Maximum price常见图像 | **有效的Maximum price常见图像 | ||
<center>[[File: CAIE2023-3.2.4-1.png | | <center>[[File: CAIE2023-3.2.4-1.png |400px]] </center> | ||
<br/> | <br/> | ||
**Maximum price的常见使用对象 | **Maximum price的常见使用对象 | ||
| 第593行: | 第596行: | ||
*Minimum price:最低价格管控。政府设定的最低价格要高于市场均衡价格,以提高商品的价格,降低需求量。 | *Minimum price:最低价格管控。政府设定的最低价格要高于市场均衡价格,以提高商品的价格,降低需求量。 | ||
**有效的Minimum price常见图像 | **有效的Minimum price常见图像 | ||
<center>[[File: CAIE2023-3.2.4-2.png | | <center>[[File: CAIE2023-3.2.4-2.png |400px]] </center> | ||
<br/> | <br/> | ||
**Minimum price的常见使用对象 | **Minimum price的常见使用对象 | ||
| 第612行: | 第615行: | ||
*Indirect tax对S曲线的影响:Indirect tax会导致S曲线整体向左移动shift leftwards。(一般不讨论对D曲线的影响)每单位税收额为两条S曲线之间的垂直距离。政府得到的总税收为税收后产量*单位税收额(图上阴影部分)。 | *Indirect tax对S曲线的影响:Indirect tax会导致S曲线整体向左移动shift leftwards。(一般不讨论对D曲线的影响)每单位税收额为两条S曲线之间的垂直距离。政府得到的总税收为税收后产量*单位税收额(图上阴影部分)。 | ||
**Indirect tax的常见图像: | **Indirect tax的常见图像: | ||
<center>[[File: CAIE2023-3.2.1-1.png | | <center>[[File: CAIE2023-3.2.1-1.png |400px]] </center> | ||
<br/> | <br/> | ||
*Indirect tax的影响 | *Indirect tax的影响 | ||
| 第632行: | 第635行: | ||
*Subsidy对S曲线的影响:Subsidy会导致S曲线整体向右移动shift rightwards。(一般不讨论对D曲线的影响)每单位补贴额为两条S曲线之间的垂直距离。政府发放的总补贴为补贴后产量*单位补贴额(图上阴影部分)。 | *Subsidy对S曲线的影响:Subsidy会导致S曲线整体向右移动shift rightwards。(一般不讨论对D曲线的影响)每单位补贴额为两条S曲线之间的垂直距离。政府发放的总补贴为补贴后产量*单位补贴额(图上阴影部分)。 | ||
**Subsidy的常见图像 | **Subsidy的常见图像 | ||
<center>[[File: CAIE2023-3.2.2-1.png | | <center>[[File: CAIE2023-3.2.2-1.png |400px]] </center> | ||
<br/> | <br/> | ||
*Subsidy的影响 | *Subsidy的影响 | ||
2023年7月27日 (四) 00:50的最新版本
如遇到公式加载异常,请刷新页面!
Section 2 The allocation of resources资源分配
2.1 Microeconomics and macroeconomics 微观经济和宏观经济
- 大纲要求
2.1.1 microeconomics 微观经济学
- Microeconomics:微观经济学,主要研究单个企业、单个商品或单个消费者等个体的经济学。本书的第一至三单元是微观经济学。
2.1.2 macroeconomics 宏观经济学
• The difference between microeconomics and macroeconomics and the decision makers involved in each.
- Macroeconomics:宏观经济学,主要研究经济整体的运行情况。本书的第四至六单元是宏观经济学。
- Economic agents:households(consumers)家庭、firms(producers)企业和government政府。
2.2 The role of markets in allocating resources 分配资源时市场的角色
- 大纲要求
2.2.1 the market system 市场体制
• How a market system works; including buyers, sellers, allocation of scarce resources, market equilibrium, and market disequilibrium.
- Free market economy:自由市场经济,指仅由市场力(供求关系)确定的价格来决定资源分配的经济体制。
- 注意:市场中包括buyers买方和sellers卖方,双方进行交换。
- Command economy:指令型经济,又称为planned economy计划经济,指仅由政府来决定资源分配的经济体制。
- 市场均衡与市场失衡【参考2.5】。
2.2.2 key resources allocation decisions 关键的资源分配决定
• Establishing that the economic problem creates three key questions about determining resource allocation - what to produce, how, and for whom.
- 对基本经济问题的细致解释:
- What to produce生产什么(生产的种类、数量与质量)
- How to produce怎么生产(资源以何种方式使用,生产的设备、技术、人员情况)
- For whom to produce为谁生产(是否每个人都能享受到生产带来的福利,收入与财富的分配)
2.2.3 introduction to the price mechanism 价格机制的介绍
• How the price mechanism provides answers to these key allocation questions.
- Price mechanism:价格机制,指通过市场供求关系确定价格,并以价格来进行资源分配的机制,是market mechanism市场机制的一种表现形式。
2.3 Demand 需求
- 大纲要求
2.3.1 definition of demand 需求的定义
• Definition, drawing and interpretation of appropriate diagrams.
- Demand:需求,指对于每个给定的价格,消费者consumers有意愿willing并且有能力able购买的产品数量。
- 注意:经济学研究的需求理论基于effective demand有效需求,即现实中能够实现的需求。
- 注意:Quantity demanded表示需求量,是数量。Demand表示的是价格与需求量的关系,是函数关系。
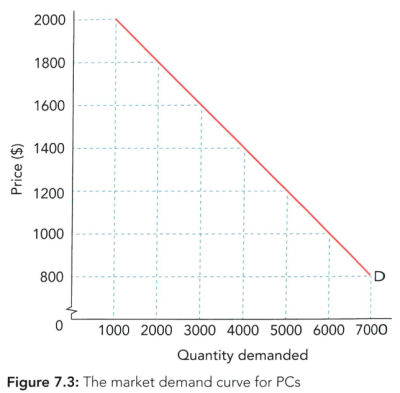
- Demand curve表示的是price价格与quantity demanded需求量之间呈反比的关系。
- 普通的demand curve如下图所示:(横轴是quantity,纵轴是price,题目中没要求数字的时候可以画成没有数据的示意图。)
2.3.2 price, demand and quantity 价格、需求和数量
• A demand curve to be drawn and used to illustrate movements along a demand curve with appropriate terminology, for example extensions and contractions in demand.
- 【参考2.3.1】。
2.3.3 individual and market demand 个人需求和市场需求
• The link between individual and market demand in terms of aggregation.
- Individual demand:个人需求,指单个消费者对产品的需求。
- Market demand:市场需求,指市场中所有人对产品的需求。市场需求等于个人需求之和。
2.3.4 conditions of demand 需求情况(影响因素)
• The causes of shifts in a demand curve with appropriate terminology, for example increase and decrease in demand.
- Movement点移动
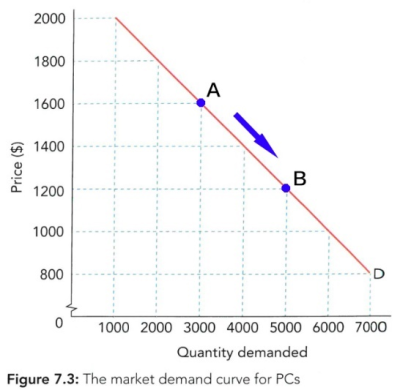
- Demand curve发生movement点移动的唯一原因是本商品的price发生了变化。Price上升会导致quantity demanded下降,反之同理。
- Movement点移动时,量的增加称为extension,量的下降称为contraction。
- Shift线移动
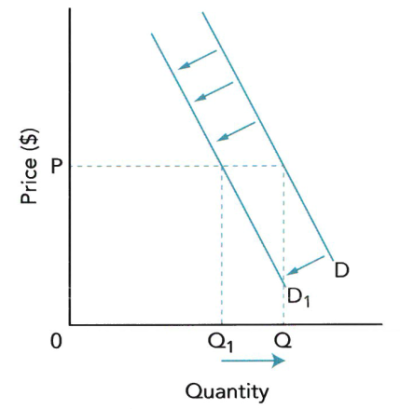
- 除了price因素之外的其他影响因素(即Non-price factors非价格因素)都会导致Demand curve发生shift型移动。
- Demand curve左移shift leftwards表示需求下降(左图所示),右移shift rightwards表示需求上升(右图所示)。

- 影响demand curve发生shift移动的原因:
- Disposable income可支配收入。
- 如果属于normal goods通常商品,收入越高,需求越高。绝大多数商品属于该种情况。
- 如果属于inferior goods劣质商品,收入越高,需求越低。
- Inferior goods的例子包括:poor quality foodstuffs、used clothing、low-grade rice and vegetables…
- Changes in the price of related products相关商品价格。
- Substitutes:替代品,指功能近似、能够满足消费者同样需求的两种商品,比如可口可乐和百事可乐。二者如果属于替代品,则A商品价格越高,B商品的需求越高。
- Complements:互补品,指组合起来能满足消费者需求的两种商品,比如电脑和鼠标。二者如果属于互补品,则A商品价格越高,B商品的需求越低。
- Advertising campaigns广告宣传
- 广告宣传越好,需求越高。
- Changes in population人口变化
- 人口越多,需求越高。
- Changes in taste and fashion品味与时尚
- 商品越时尚流行,越符合人们的习惯和口味,需求越高。
- Weather condition
- 天气情况变化,商品需求也会发生变化,比如天气热,则对冰淇淋的需求增加。
- Expectation about future price
- 对未来价格提升的担忧,会导致当前的需求增加(趁涨价前赶紧购买)。
- Disposable income可支配收入。
2.4 Supply 供给
- 大纲要求
2.4.1 definition of supply 供给的定义
• Definition, drawing and interpretation of appropriate diagrams.
- Supply:供给,指对于每个给定的价格,生产者producers有意愿willing并且有能力able生产并提供的产品数量。
- 注意:Quantity supplied表示供给量,是数量。Supply表示的是价格与供给量的关系,是函数关系。
- Supply curve表示的是price价格与quantity supplied供给量之间呈正比的关系。
- 普通的supply curve如下图所示:(横轴是quantity,纵轴是price,题目中没要求数字的时候可以画成没有数据的示意图。)

2.4.2 price, supply and quantity 价格、供给和数量
• A supply curve to be drawn and used to illustrate movements along a supply curve with appropriate terminology, for example extensions and contractions in supply.
- 【参考2.4.2】。
2.4.3 individual and market supply 个人供给和市场供给
• The link between individual and market supply in terms of aggregation.
- Individual supply:个人供给,指单个生产者对产品的供给。
- Market supply:市场供给,指市场中所有生产者对产品的供给。市场供给等于个人供给之和。
2.4.4 conditions of supply 供给情况(影响因素)
• The causes of shifts in a supply curve with appropriate terminology, for example increase and decrease in supply.
- Movement点移动
- Supply curve发生movement点移动的唯一原因是本商品的price发生了变化。Price上升会导致quantity supplied上升,反之同理。
- Movement点移动时,量的增加称为extension,量的下降称为contraction。

- Shift线移动
- 除了price因素之外的其他影响因素(即Non-price factors非价格因素)都会导致Supply curve发生shift型移动。【参考1.1.3(f)】
- Supply curve左移shift leftwards表示供给下降(左图所示),右移shift rightwards表示供给上升(右图所示)。
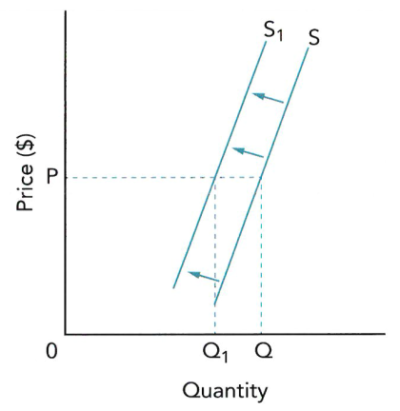
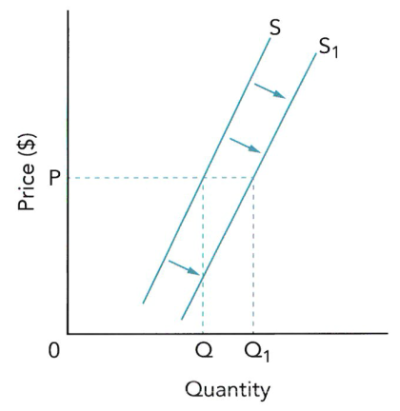
- 影响supply curve发生shift移动的原因:
- Changes in the costs of production成本。
- 成本包括原材料成本(price of raw materials),能源成本(price of oil等),人力成本(wage等),维护成本(maintenance costs),分销成本(distribution costs)。成本越高,供给越少。
- Improvement in technology技术进步。
- 技术水平越高,供给越多。
- Productivity生产率。
- 生产率越高,供给越多。
- Government policy政府政策。
- Taxation税收越多,供给越少。
- Subsidy补贴越高,供给越多。
- 政府政策越松(relaxation of certain types of legislation),供给越多。
- Weather conditions天气情况。
- (一般和农业相关)天气或气候越好,供给越多。反之,天气或气候越差,供给越少。
- Price of other products其他商品价格。
- 其他商品价格的上升,会使得企业将生产要素转移到其他商品上,减少原本商品的生产。
- Disasters and wars灾害和战争。
- 灾害和战争会减少生产要素,供给降低。
- Discoveries and depletions of commodities发现和消耗大宗商品。
- 新发现资源,会增加供给。
- 消耗掉资源,会减少供给。
2.5 Price determination 价格决定
- 大纲要求
2.5.1 market equilibrium 市场均衡
• Definition, drawing and interpretation of demand and supply schedules and curves used to establish equilibrium price and sales in a market.
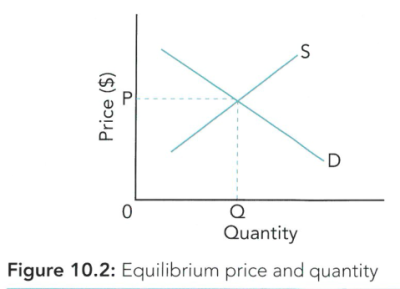
- Market equilibrium:市场均衡。此时市场需求量与市场供给量相等,如果没有外部影响,价格将长期停留在该水平,没有再变化的倾向no tendency to change。
- 市场均衡时的价格叫equilibrium price,需求量/供给量叫equilibrium quantity。此时,称为市场出清market clears。
- Market equilibrium常见图像:
2.5.2 market disequilibrium 市场不均衡
• Definition, drawing and interpretation of demand and supply schedules and curves used to identify disequilibrium prices and shortages (demand exceeding supply) and surpluses (supply exceeding demand).
- Market disequilibrium:市场失衡。此时市场需求量与市场供给量不相等。主要分为以下两种情况。
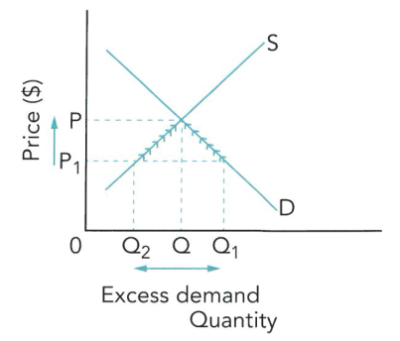
- Excess demand:超额需求(价格偏低)。在当前价格下,需求量高于供给量。
- 出现shortage短缺(P1价格时,图中shortage部分为Q2Q1的长度)。
- 如果市场正常运转,价格将上涨到均衡价格,此时quantity supplied增加,quantity demanded减少,因此shortage消失。
- Excess demand常见图像:
- Excess demand:超额需求(价格偏低)。在当前价格下,需求量高于供给量。
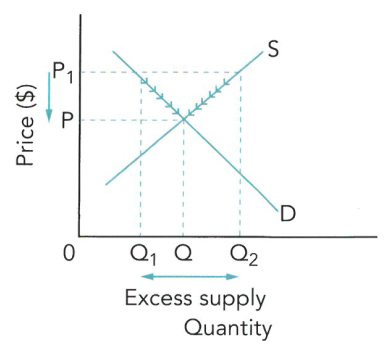
- Excess supply:超额供给(价格偏高)。在当前价格下,供给量高于需求量。
- 出现surplus盈余(P1价格时,图中surplus部分为Q1Q2的长度)。
- 如果市场正常运转,价格将下跌到均衡价格,此时quantity supplied减少,quantity demanded增加,因此surplus消失。
- Excess supply常见图像:
- Excess supply:超额供给(价格偏高)。在当前价格下,供给量高于需求量。
- 注意(评价):完全交给市场调节,可能有以下问题:
- Time lags:时滞。市场调节需要一定时间,无法一步调节到位。比如,Influenced by how long it takes consumers and producers to make known the price. 消费者和生产者得知价格不在均衡位置上需要一段时间。
- Stay in disequilibrium for a long time due to geographical or other problems.因为种种原因长期滞留于不均衡位置。如交通障碍、国界、天气原因等。
2.6 Price changes 价格变化
- 大纲要求
2.6.1 causes of price changes 价格变化的原因
• Changing market conditions as causes of price changes.
- 市场均衡价格的变化主要由于demand curve和supply curve发生了位置变化。
- D线和S线发生变化的原因【参考2.3.4和2.4.4】。
2.6.2 consequences of price changes 价格变化的影响
• Demand and supply diagrams to be used to illustrate these changes in market conditions and their consequences for equilibrium price and sales.
- Demand curve与supply curve线移动shift的原因可【参考1.1.3(c)和1.1.3(f)】。
- Demand curve与supply curve线移动shift后,均衡点发生变化,相应的equilibrium price和equilibrium quantity也会跟着发生变动。(如下图所示)
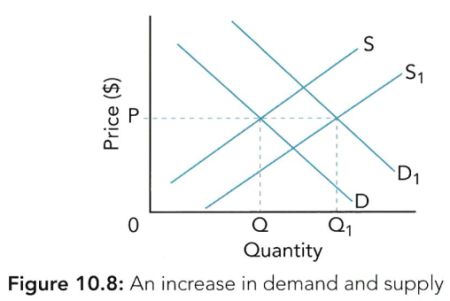
- 注意:考试时画完图像后,需要对图像进行解释和描述。文字部分主要围绕shift线移动的原因、移动方向、均衡价格和均衡数量的变化情况来进行描述。
2.7 Price elasticity of demand (PED) 需求的价格弹性
- 大纲要求
2.7.1 definition of PED PED的定义
- Price elasticity of demand(PED):需求的价格弹性,指当价格发生一定程度的变化时,需求量对价格变化的反应程度responsiveness。
- 注意:所谓反应程度responsiveness,可以理解为需求量的变化幅度。影响因素变动幅度相同时,需求量变化幅度越大,弹性越大。
2.7.2 calculation of PED PED的计算
• Calculation of PED using the formula and interpreting the significance of the result. Drawing and interpretation of demand curve diagrams to show different PED.
- \(PED=\frac{percentage\space change\space in\space quantity\space demanded}{percentage\space change\space in\space price}=\frac{\displaystyle{\%}\Delta Q}{\displaystyle{\%}\Delta P}\), 其中\(\displaystyle{\%}\Delta Q=\frac{Q_{2}-Q_{1}}{Q_{1}}\), \(\displaystyle{\%}\Delta P=\frac{P_{2}-P_{1}}{P_{1}}\)
- 注意:PED一般是负数,因为价格和需求量的变化方向相反。
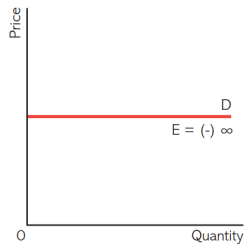
- PED各弹性分类情况如下表所示(PED value已经忽略符号,图像为整条Demand curve中的很小一段的截图)
| Elasticity description | Value | PED Diagram |
|---|---|---|
| perfectly elastic 完全弹性 |
∞ infinity |
|
| (highly) elastic 富有弹性 |
>1 | 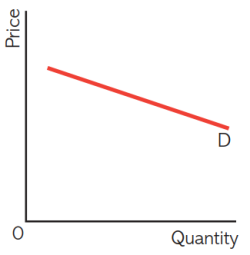
|
| unit elasticity (始终保持1的)单位弹性 |
1 | 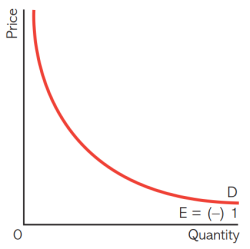
|
| (highly) inelastic 缺乏弹性 |
0~1 | 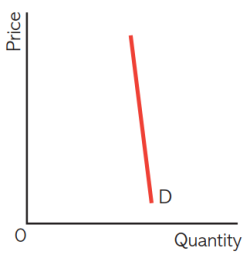
|
| perfectly inelastic 完全无弹性 |
0 | 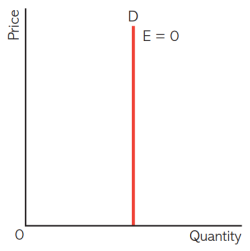
|
- 完整Demand curve上的弹性变化:
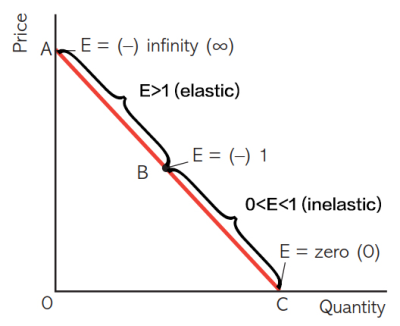
- 在完整的Demand curve中,弹性的数值随着需求量的增加而不断下降,从偏elastic到偏inelastic。(注意区分本完整图与上表中的分段图像。)
- Unitary elasticity的对应点为Demand curve的中点。
- 特别注意:弹性与直线的斜率不是同一个概念,不要混淆。
2.7.3 determinants of PED PED的影响因素
• The key influences on whether demand is elastic or inelastic.
- Availability and attractiveness of (consumption) substitutes消费替代品的可获得性及吸引力
- 替代品种类越多,PED越大。
- 替代品功能越相近,PED越大。
- 商品概念越宽泛,PED越小。(如food的PED比pizza的PED要小)
- Proportion of income商品消费占收入的比重
- 商品消费占收入的比重越大,PED越大。
- Time时间
- 时间越长,PED越大。
- Addiction成瘾性
- 越容易上瘾的东西,PED越小。(如追星、烟酒、爱好等等的PED偏小)
- Durability耐久性(whether its purchase can be postponed购买是否可推迟)
- 商品使用年限越长,PED越大。
- Necessity必要性
- 一般来说必需品necessity goods的PED偏小,而奢侈品luxury goods的PED偏大。
- The brand image品牌
- 品牌忠诚度越高,PED越小。
2.7.4 PED and total spending on a product/revenue PED和总收入
• The relationship between PED and total spending on a product/revenue, both in a diagram and as a calculation.
- PED与总花费total expenditure/总收入total revenue之间的关系如下表所示:
| Elasticity description | Logical analysis | Total revenue (Total expenditure) |
|---|---|---|
| perfectly elastic | P→ | (P不变,随着Q增加而上升) |
| (highly) elastic | P ↑, Q ↓↓ | TR或TE ↓ |
| P ↓, Q ↑↑ | TR或TE ↑ | |
| unitary elasticity (始终保持unitary) |
P ↑, Q ↓ | TR或TE → |
| P ↓, Q ↑ | ||
| (highly) inelastic | P ↑↑, Q ↓ | TR或TE ↑ |
| P ↓↓, Q ↑ | TR或TE ↓ | |
| perfectly inelastic | P ↑, Q → | TR或TE ↑ |
| P ↓, Q → | TR或TE ↓ |
- 注意:PED与total expenditure之间的关系可以互推。比如PED为elastic时,价格下降会带来TE上升。同时,如果价格下降能带来TE上升,则该商品PED为elastic。其他情况同理。
2.7.5 significance of PED PED的重要性
• The implications for decision making by consumers, producers and government.
- 根据PED的情况,可以去了解:
- Price variations in a market 市场价格变动
- Changing prices on consumer expenditure and sales revenue 价格变动对销售额(消费者花费)的影响,用来制定相应的盈利策略,比如是否可以通过降价促销来增加利润。
- 企业可通过persuasive advertising广告、branding建立品牌、takeovers or mergers兼并收购、monopoly垄断等手段来降低商品PED,从而达到涨价多赚Total revenue的目的。
- 因为商品是elastic而采用打折降价促销的方式可以打开市场,让消费者习惯使用该商品,从而在非打折期也来购买该商品,从而持久性增加TR。但该手段有一定风险性,因为人们会在非打折期减少该商品的消费而等待打折,竞争对手也可能会同时降价而导致降价难以达到增加TR的目的(甚至有可能因为竞争对手抢夺市场而下降)
- Effects of changes in indirect taxes on government income 间接税变化对政府收入的影响
2.8 Price elasticity of supply (PES) 供给的价格弹性
- 大纲要求
2.8.1 definition of PES PES的定义
- Price elasticity of supply(PES):供给的价格弹性,指当价格发生一定程度的变化时,供给量对价格变化的反应程度responsiveness。
2.8.2 calculation of PES PES的计算
• Calculation of PES using the formula and interpreting the significance of the result.
• Drawing and interpretation of supply curve diagrams to show different PES.
- \(PES=\frac{percentage\space change\space in\space quantity\space supplied}{percentage\space change\space in\space price}=\frac{\displaystyle{\%}\Delta Q}{\displaystyle{\%}\Delta P}\), 其中\(\displaystyle{\%}\Delta Q=\frac{Q_{2}-Q_{1}}{Q_{1}}\), \(\displaystyle{\%}\Delta P=\frac{P_{2}-P_{1}}{P_{1}}\)
- 注意:PES一般是正数,因为价格和供给量的变化方向相同。
- PES也分为perfectly elastic, (highly) elastic, unitary elasticity, (highly) inelastic, perfectly inelastic。PES弹性数值分类与PED一致,图像如下表所示。(图像为整条Supply curve中的很小一段的截图)
| Elasticity description | Value | PES Diagram |
|---|---|---|
| perfectly elastic 完全弹性 |
∞ infinity |
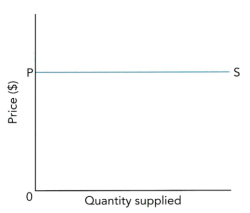
|
| (highly) elastic 富有弹性 |
>1 | 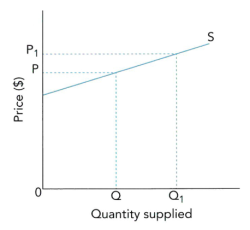
|
| unit elasticity (始终保持1的)单位弹性 |
1 | 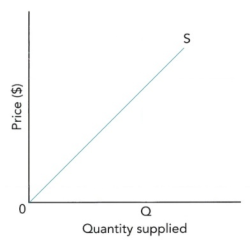
|
| (highly) inelastic 缺乏弹性 |
0~1 | 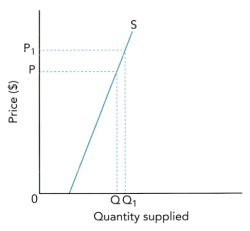
|
| perfectly inelastic 完全无弹性 |
0 | 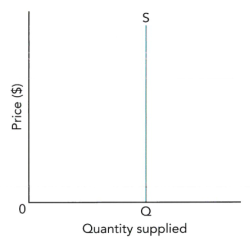
|
2.8.3 determinants of PES PES的影响因素
• The key influences on whether supply is elastic or inelastic.
- Availability of (production) substitutes生产替代品的可获得性(也可以称为cost of altering its supply更换供给的成本)
- 生产替代品主要指同一生产线可生产的多种产品。该商品生产线可生产的商品种类越多,该商品的PES越大。(也可以说如果生产要素更容易转换到其他产品的生产时,PES越大。)
- Availability of stocks存货/Durability耐久性(Perishable易腐烂的)
- 商品存货越多,PES越大。
- 商品越方便长时间保存,PES越大。
- Spare capacity空余产能
- 空余产能越多,PES越大。
- Time period时间
- 时间越长,PES越大。(生产要素可能无法在短期内进行转换;技术会进步)
- Barriers门槛
- 进入该行业门槛越低,PES越大。
2.8.4 significance of PES PES的重要性
• The implications for decision making by consumers, producers and government.
- 企业通过查看PES的情况,可以respond to changing market conditions应对变化的市场情况,确定商品的供给能否对价格变动做出迅速调整,并根据情况制定相应的生产计划和对策。
- 如商品市场可以考虑建仓库等。
- 农业市场一般PES偏小inelastic,要注意需求的波动对价格的大幅影响,注意防范风险。
2.9 Market economic system 市场经济体制
- 大纲要求
2.9.1 definition of market economic system 市场经济体制的定义
- Free market economy:自由市场经济,指仅由市场力(供求关系)确定的价格来决定资源分配的经济体制。
- Command economy:指令型经济,又称为planned economy计划经济,指仅由政府来决定资源分配的经济体制。
- Efficiency效率:常见的效率包括以下三种。
- Productive efficiency:生产效率。企业以最低的平均成本进行生产。
- 竞争Competition能够促进企业去追求productive efficiency。如果不能达到足够低的成本,企业赚不到足够的利润,产品售价偏高也会导致消费者减少购买,最后会倒闭。
- Allocative efficiency:分配效率。企业生产的数量能够充分满足消费者的需求,使其效用最大化。
- 竞争Competition也能够促进企业去追求allocative efficiency。如果不能迎合消费者的需求,生产出的东西将无人问津,会亏损。但如果迎合消费者,则会获得高额的利润。
- Dynamic efficiency:动态效率。企业通过诸如技术革新、研发等手段在长期内保持生产效率,达成资源的有效分配。
- Productive efficiency:生产效率。企业以最低的平均成本进行生产。
2.9.2 advantages and disadvantages of the market economic system 市场经济体制的优缺点
• Including examples of how it works in a variety of different countries.
- 市场经济的优点:
- Very responsive to changes in consumer demand. 对消费者的需求能够迅速反应
- Resources should change automatically and quickly to reflect changes in consumer demand. 对资源的分配能够随着消费者需求变化自动并快速变化
- There are choices. 消费者选择多
- Costs and prices may be low. 成本降低,产品价格降低
- Quality may be high. 产品质量提高
- 市场经济的缺点:
- Consumers and private sector firms may only take into account the costs and benefits to themselves, and not the causes and benefits of their decisions to others. (Externality) 消费者和私企只考虑自身成本与收益,而不考虑对第三方的影响(外部性)
- Competition between firms should ensure efficiency, but there may be little competition. (Monopoly) 如果市场缺乏竞争,就难以保持效率(垄断)
- Even when there is competition and firms want to respond to deserves of consumers, they may not be able to do this. (Factor immobility) 即使企业希望为消费者的需求做出反应,但有时力不从心(生产要素的不可移动性)
- Firms will not make products unless they think they can charge for them. (Public goods) 企业不会提供不盈利的商品(公共产品的存在)
- Advertising can distort consumer choice. (Information failure) 广告会扭曲消费者的选择(信息失灵)
- Market forces sometimes result in what may be regarded to be inequitable outcomes. (Income inequality or inequity) 市场力有时会导致不公正的结果(收入不平等)
- Differences in income will increase over time. 贫富差距逐渐加大
2.10 Market failure 市场失灵
- 大纲要求
2.10.1 definition of market failure 市场失灵的定义
• The key terms associated with market failure: public good, merit good, demerit good, social benefits, external benefits, private benefits, social costs, external costs, private costs.
- Market failure:市场失灵,指free markets自由市场无法有效率地配置资源的情况。(inefficient resource allocation)
- Public goods公共产品:具有non-excludability和non-rivalry两种特征。
- 举例:police force警察, national defence (national security) 国防, fire protection消防, street lights路灯, non-toll roads不收费公路, traffic lights交通灯, lighthouse灯塔, flood control systems防洪系统。
- Public goods公共产品带来的问题:free rider problem。一旦有人提供了公共产品,其他人都可以免费使用(主要是non-excludability的特征导致)。因为有了该问题,私人企业无法从公共产品上盈利,因此不会提供公共产品。
- 解决私人企业不提供公共产品的办法:【可参考3.2】
- 政府直接提供direct provision by the government
- 政府补贴私人企业subsidies
- Merit goods:有益商品。由于信息失灵,消费者对产品的好处估计不足,从而导致消费量低于社会正常消费量,出现underconsumption和underproduction。
- 举例:vaccine、healthcare、education…
- Demerit goods:有害商品。由于信息失灵,消费者对产品的坏处估计不足,从而导致消费量高于社会正常消费量,出现overconsumption和overproduction。
- 举例:cigarette、tobacco、alcohol、junk food…
- 解决merit goods有益商品和demerit goods有害商品的办法主要在于解决information failure的问题,比如加强宣传campaign、强制进行义务教育compulsory education、进行第三方质检inspection schemes、免责条款exclusion clauses、健康体检等。也可以通过价格调整使得人们调整需求,如补贴subsidies和税收taxation。
- Externality:外部性。对第三方带来的收益或成本(side effects副作用)。
- Third parties:第三方。指不属于交易双方的其他经济个体。
- 外部性不在private sector私人部门的考量范围内,因此不会体现在价格中。
- Private benefit:私有收益,指企业或个人单独获得的收益。
- Private cost:私有成本,指企业或个人单独承担的成本。
- External benefit:外部收益,指对第三方带来的额外收益。
- External cost:外部成本,指对第三方带来的额外成本。
- Social benefit:社会收益,指的是社会所有群体的收益,包括交易双方的收益(Private benefits私有收益)与对第三方(其他人)的收益(External benefits外部收益)。
- Social benefits (SB) = Private benefits (PB) + External benefits (EB)
- Social cost:社会成本,指的是社会所有群体的成本,包括交易双方的成本(Private costs私有成本)与对第三方(其他人)的成本(External costs外部成本)。
- Social costs (SC) = Private costs (PC) + External costs (EC)
2.10.2 causes of market failure 市场失灵的原因
• With respect to public goods, merit and demerit goods, external costs and external benefits, abuse of monopoly power and factor immobility.
• Examples of market failure with respect to these areas only.
- Failure to take into account all costs and benefits 没有考虑全部的收益和成本
- Negative externality:负外部性,指给第三方带来负面的影响。由于企业不会考虑该类负面影响,因此产出偏多,存在over-production的问题。如下图所示:
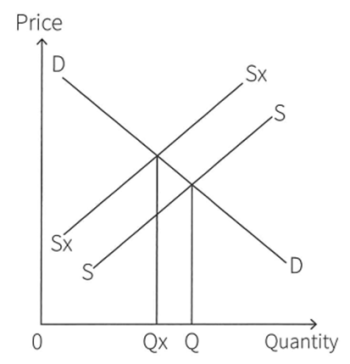
- 上图中,S线为企业仅考虑自身成本的supply curve,Sx线为政府考虑了所有成本的supply curve。按照企业的情况,市场会在Q处进行生产。而按照政府的情况,市场应该在Qx处进行生产。因此,当负外部性存在时,企业会over-produced过度生产。
- Positive externality:正外部性,指给第三方带来正面的影响。由于消费者不会考虑该类正面影响,因此消费偏少,存在under-consumption的问题。如下图所示:
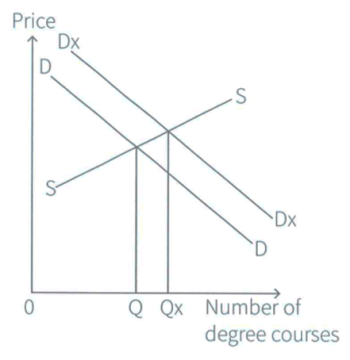
- 上图中,D线为消费者仅考虑自身利益的demand curve,Dx线为政府考虑了所有收益的demand curve。按照消费者的情况,市场会在Q处进行消费。而按照政府的情况,市场应该在Qx处进行消费。因此,当正外部性存在时,消费者会under-consumed消费不足。
- Information failure信息失灵
- A lack of information信息缺失
- Inaccurate information不准确的信息
- Asymmetric information不对称信息,即买方和卖方中有一方比另一方知道更多的信息。
- Merit goods有益商品的存在【参考2.10.1】
- Demerit goods有害商品的存在【参考2.10.1】
- Public goods公共产品的存在【参考2.10.1】
- Abuse of monopoly power垄断力的滥用
- 如果企业具有一定垄断力,则会成为price maker价格制定者,可能会制定比正常市场价更高的价位,生产更少的产品。
- Immobility of resources资源的不可移动性,降低了生产的灵活性和效率。
- Short-termism短视主义
- 一些企业只注重眼前利益而没有关注长期利益,导致生产不可持续,后续投资减少,环境受到破坏。
2.10.3 consequences of market failure 市场失灵的影响
• The implications of misallocation of resources in respect of the over consumption of demerit goods and goods with external costs, and the under consumption of merit goods and goods with external benefits.
• Note: demand and supply diagrams relating to market failure are not required.
- 各类原因造成的市场失灵带来的影响【参考2.10.2】。
2.11 Mixed economic system 混合经济体制
- 大纲要求
2.11.1 definition of the mixed economic system 混合经济体制的定义
- Mixed economy:计划经济。市场和政府共同决定生产计划。
- 世界上绝大多数国家都实行的是mixed economy。
- 常见的一些国家处于mixed economy中的位置:

- Mixed economy混合经济对市场经济的改进:
- The government should take into account all the costs and benefits that will arise from their decisions. 政府会考虑所有收益和成本
- Government can encourage the consumption of that are more beneficial for consumers. 政府会鼓励对消费者有益的消费(鼓励使用merit good有益商品)
- Government can discuss the consumption that are more harmful for consumers. 政府会减少对消费者有害的消费(限制使用demerit good有害商品)
- Government can finance the production of products that cannot be charged directly. 政府会直接投资生产私企不生产的商品(直接提供public good公共产品)
- Government can seek to prevent private sector firms from exploiting by charging high prices. 政府可以阻止垄断企业制定高价格
- Government is likely to seek to make maximum use of resources. 政府会寻求最大限度地利用好资源提升福利
- There is a possibility that the government will plan ahead to a greater extent than private sector firms. (investment) 政府比私企更具有大局观和前瞻性
- Government can help vulnerable groups, ensuring that they have access to basic necessities. 政府会帮助社会中的弱势群体,保证其生存基本条件
2.11.2 government intervention to address market failure 政府干预以解决市场失灵
• Definitions, drawing and interpretation of appropriate diagrams showing the effects of three government microeconomic policy measures: maximum and minimum prices in product, labour and foreign exchange markets; indirect taxation; and subsidies.
• The implications of other government microeconomic policy measures: regulation; privatisation and nationalisation; and direct provision of goods.
• The effectiveness of government intervention in overcoming the drawbacks of a market economic system.
- Maximum price:最高价格管控。政府设定的最高价格要低于市场均衡价格,以压低商品的价格,增加需求量。
- 有效的Maximum price常见图像
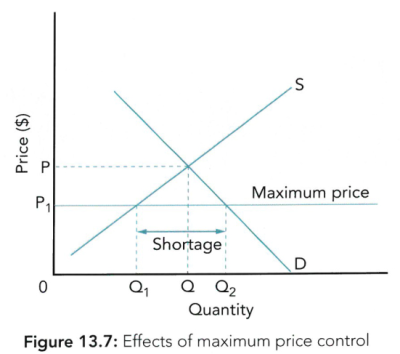
- Maximum price的常见使用对象
- necessity goods必需品、merit goods有益商品等。如面包、汽油、(廉租)房房租、水费、交通费用等。
- Maximum price的好处
- 降低价格。
- 增加需求量。
- Maximum price的问题
- 长期存在shortage,一部分人需求难以满足,会导致排队queuing、定额分配rationing(每个人的需求都无法完全满足)、黑市(informal / underground / black market)……
- 无效的maximum price管控
- 如果将maximum price定到了市场均衡价格之上,市场将会在原均衡价格处进行交易,管控政策无法起到任何效果。
- Maximum price的常见使用对象
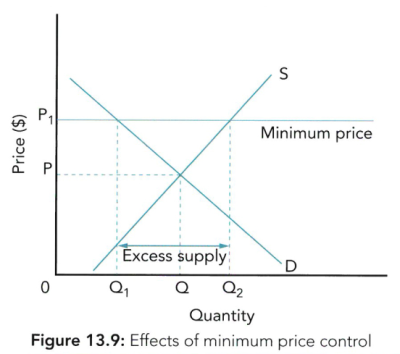
- Minimum price:最低价格管控。政府设定的最低价格要高于市场均衡价格,以提高商品的价格,降低需求量。
- 有效的Minimum price常见图像
- Minimum price的常见使用对象
- imported goods进口品、demerit goods有害商品、national minimum wage国家最低工资、agricultural goods农产品等。
- Minimum price的好处
- 降低有害商品需求量,解决over-consumption的问题。
- 降低进口消费,减少国际收支账户逆差。
- 保护劳动者利益,提高低收入者、农民的福利。
- Minimum price的问题
- 长期存在surplus,会导致资源浪费waste、降低效率inefficient、企业不主动降低成本(农业市场中,政府会收购多余的surplus,以上问题不会非常严重)
- 真实工资型失业real wage unemployment
- 黑市(informal market)…
- 无效的Minimum price管控
- 如果将minimum price定到了市场均衡价格之下,市场将会在原均衡价格处进行交易,管控政策无法起到任何效果。
- Minimum price的常见使用对象
- Indirect tax:间接税,主要是对商品和服务的税收。政府向企业征税,企业可以将税收的一部分转移给消费者去承担。如VAT(Value-added tax增值税)、GST(General Sales tax消费税)等。
- 和indirect tax相对的是direct tax直接税。直接税是政府对收入进行收税,纳税主体无法将税收转移给其他人,如个人所得税、公司税(对公司利润征税)等。
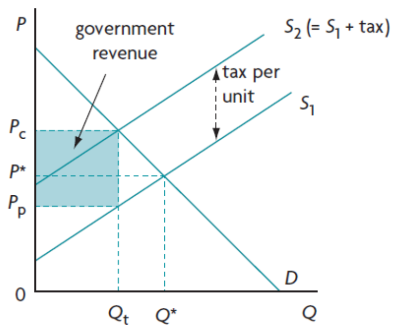
- Indirect tax对S曲线的影响:Indirect tax会导致S曲线整体向左移动shift leftwards。(一般不讨论对D曲线的影响)每单位税收额为两条S曲线之间的垂直距离。政府得到的总税收为税收后产量*单位税收额(图上阴影部分)。
- Indirect tax的常见图像:
- Indirect tax的影响
- 好处:
- 能够internalise externalities内化外部性,减少一些负面外部性带来的危害。
- 比起direct tax容易瞒报和偷税漏税的风险,indirect tax更容易收取。
- 消费者对于是否交税有选择性(可通过不购买该商品而不交税)。
- 问题:
- 增加消费者负担,增加生产成本,社会福利损失
- 通货膨胀压力
- 偷税漏税问题tax evasion,腐败corruption
- 额外行政成本administrative costs
- 商品价格偏高,国际竞争力下降,贸易容易出现逆差。
- 难以对需要征收的税收额进行准确估计,因为对externality的数值难以测量。
- 如果商品是price inelastic,那么采用税收来减少使用数量的有效性将被削弱。
- 好处:
- Subsidy:补贴。由政府拨款,一般发放给生产者。
- 主要用途包括:降低必需品essential goods的价格、鼓励merit goods消费、促进收入分配公平more equitable distribution of income、鼓励提供公共产品public goods、提高生产者收入(主要是农民收入)、提高出口品产量及竞争力、补贴本国商品以减少进口品消费等。
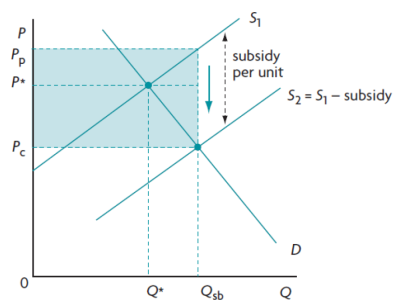
- Subsidy对S曲线的影响:Subsidy会导致S曲线整体向右移动shift rightwards。(一般不讨论对D曲线的影响)每单位补贴额为两条S曲线之间的垂直距离。政府发放的总补贴为补贴后产量*单位补贴额(图上阴影部分)。
- Subsidy的常见图像
- Subsidy的影响
- 好处:
- 能够降低价格,减少消费者负担。
- 节约企业成本,提升产出,鼓励投资新项目新技术。
- 扶持公共部门,提供public goods公共产品。
- 为低收入群体提供就业机会、为老人提供医疗保障、减少环境污染等,提升社会总福利。
- 问题:
- 增加政府支出,有机会成本opportunity costs。
- 企业养成补贴依赖性,降低生产效率。
- 影响市场机制market mechanism运行,有市场失灵market failure。
- 具体合适的补贴量难以估计difficult to measure。
- 无法体现出与收入income或支付能力ability to pay的相关性。(补贴难以花在刀刃上)
- 好处:
- Regulation:法律法规。政府通过制定法律法规,来限制企业的排污、剥削、生产劣质产品等行为,或者来鼓励人们上学、获取医疗服务等。
- 政策带来的好处:
- Being backed up by law. 有法律依据,执行力强
- Easily be understood. 容易被大家理解
- 政策带来的坏处:
- Administrative costs. 有行政成本
- A regulation works only if most people agree with it. 只有大家愿意共同遵守,法律才能起到相应效果
- Regulations do not directly compensate those who suffer as a result of market failure. 法律无法保证由于市场失灵而利益受损的群体得到完全补偿
- Regulations may be too restrictive – reducing market flexibility and creating barriers to entry. 有时法律过于严苛,降低市场灵活性,提高了门槛
- 政策带来的好处:
- Nationalisation:国有化。指的是企业的所有权由私人(或私企)所有转为国家所有。
- 适用范围:natural monopoly、merit goods、negative production externality
- 政策带来的好处:
- State-owned enterprises base their decisions on the full costs and benefits involved. 国企会考虑所有收益和成本
- State-owned enterprises can be used to influence economic activity. 国企可用于影响国家的经济活动(带头响应政府政策)
- A state-owned enterprise would not abuse its market power when it is natural monopoly. 自然垄断下的国企不会滥用对市场的垄断力(不会抬高价)
- Ownership of a whole industry by the government makes planning and coordination easier. 更便于政府对经济制定计划
- It is important to ensure that basic industries survive, charge low prices and produce good quality, as other domestic industries depend on them. 保证基础工业存活,物美价廉
- 政策可能带来的问题:
- State-owned enterprises can be difficult to manage and control. 国企规模较大,难以管理和控制
- State-owned enterprises may become inefficient, produce low quality products and charge relatively high prices, due to a lack of competition and the knowledge that they cannot go bankrupt. 国企生产效率低下,由于缺乏竞争或没有破产风险而丧失降低成本和投资研发的动力,产品质量差,价格高
- State-owned enterprises will need to be subsidised if they are loss making. The use of tax revenue to support them has an opportunity cost. 国企如果亏损则需要政府补贴
- Privatisation:私有化。指的是企业的所有权由国家所有转为私人(或私企)所有。
- 适用范围:monopoly、inefficient production。
- 政策带来的好处:
- Private sector firms are likely to produce the products desired by consumers, at a low cost and offer them at low prices. 私企能够关注消费者的需求,并通过降低成本来降低价格
- Freedom from government regulation may reduce administration costs and enable managers to respond more quickly to changing conditions. 政府政策的放松降低了行政成本,使得企业能够更快根据市场情况做出调整
- Provide an incentive for firms to be efficient. 竞争使得企业有动力提高效率
- There may be less risk of under-investment. 企业更愿意投资(投资不足的风险下降)
- 政策可能带来的问题:
- Some private sector firms may not face competition – they may be monopolies. (be inefficient, charge high prices and produce low quality products) 垄断企业不会面临竞争,生产效率低下,会抬高价格,缩减生产
- Private sector firms may not take into account the total costs and benefits to the society due to their actions. 私企不会考虑全社会的福利情况(有市场失灵的风险)
- Direct provision of goods:政府直接提供某些商品和服务,主要针对public goods和merit goods。
- 好处:保证必要商品的供应,提升福利。
- 问题:资源浪费(由于没有价格而过度提供over-provision)。
- Cost-benefit analysis(CBA):通过计算某个项目或决策的social benefits社会收益和social costs社会成本来进行决策分析。
- 决策原则:
- 当确定一个方案是否实行时,判断social benefits与social costs的大小关系。当social benefits≥social costs(benefit:cost ratio≥1)时,实行该方案;当social benefits<social costs时,否决该方案。
- 当从若干个方案中选择一个实行时,计算每个方案的net social benefits(即social benefits – social costs),选择最高的方案实行。如果net social benefits全部小于0,则一个都不实行。
- 决策原则:


