“9708-2023-specimen-paper-2”的版本间的差异
| 第11行: | 第11行: | ||
==Data response== | ==Data response== | ||
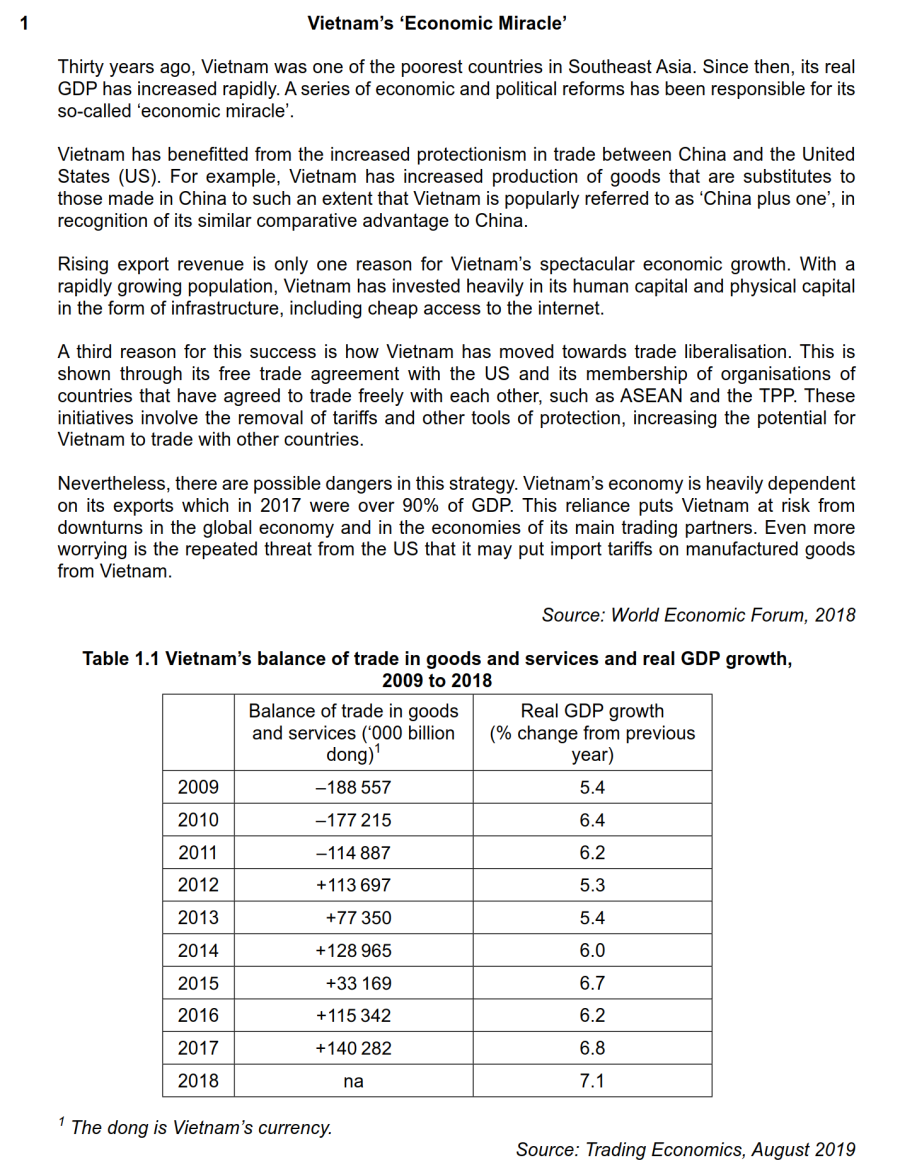
<center> [[File:9708-2023-specimen-paper-2_1Passage.png| | <center> [[File:9708-2023-specimen-paper-2_1Passage.png|900px]]</center> | ||
<br/> | <br/> | ||
| 第47行: | 第47行: | ||
{| | {| | ||
|- | |- | ||
| align="right" valign="top" |'''题目1a'''|| || [[File:9708-2023-specimen-paper-2_1a.png| | | align="right" valign="top" |'''题目1a'''|| || [[File:9708-2023-specimen-paper-2_1a.png|800px]] | ||
|- | |- | ||
| align="right" |'''题目类型'''|| || '''图表分析''' | | align="right" |'''题目类型'''|| || '''图表分析''' | ||
| 第57行: | 第57行: | ||
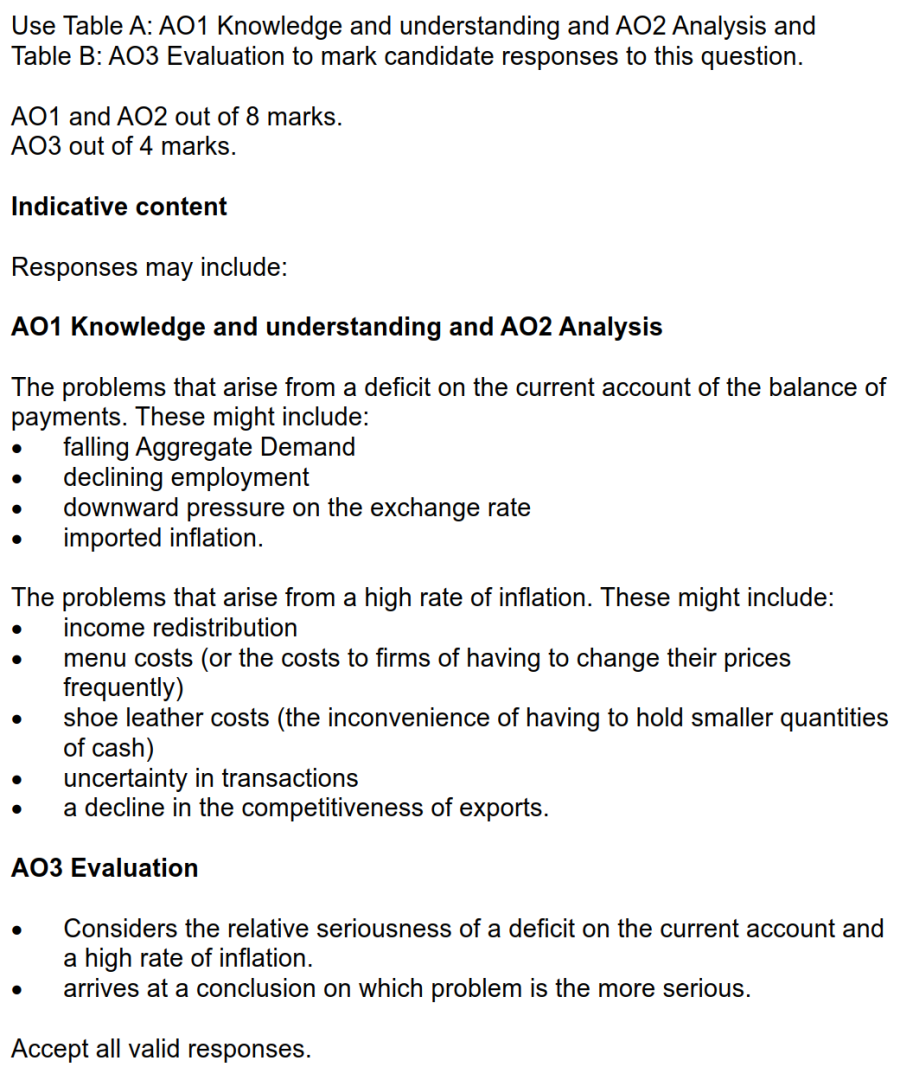
| align="right" valign="top" width="100px" |'''解答要点'''|| || ● 对两段时期内的balance of trade分别进行定性(deficit或surplus),1分。<br/>● 然后对两段时期内的变化趋势(上升、下降)进行描述,1分。 | | align="right" valign="top" width="100px" |'''解答要点'''|| || ● 对两段时期内的balance of trade分别进行定性(deficit或surplus),1分。<br/>● 然后对两段时期内的变化趋势(上升、下降)进行描述,1分。 | ||
|- | |- | ||
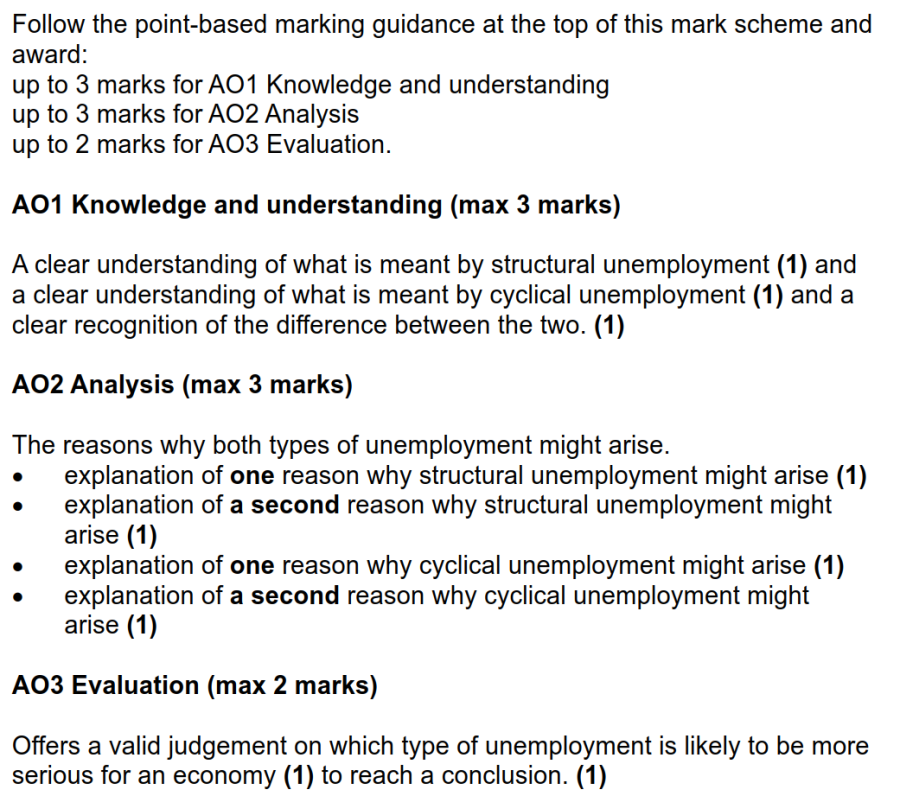
| align="right" valign="top" |'''官方答案'''|| ||[[File:9708-2023-specimen-paper-2_1a-MS.png| | | align="right" valign="top" |'''官方答案'''|| ||[[File:9708-2023-specimen-paper-2_1a-MS.png|600px]] | ||
|- | |- | ||
| align="right" valign="top" |'''文字版备查'''|| ||<small>(a) Using the data in Table 1.1, compare Vietnam’s balance of trade in goods and services between 2009 and 2011 with that from 2015 to 2017. [2]</small> | | align="right" valign="top" |'''文字版备查'''|| ||<small>(a) Using the data in Table 1.1, compare Vietnam’s balance of trade in goods and services between 2009 and 2011 with that from 2015 to 2017. [2]</small> | ||
| 第65行: | 第65行: | ||
{| | {| | ||
|- | |- | ||
| align="right" valign="top" |'''题目1bi'''|| || [[File:9708-2023-specimen-paper-2_1bi.png| | | align="right" valign="top" |'''题目1bi'''|| || [[File:9708-2023-specimen-paper-2_1bi.png|800px]] | ||
|- | |- | ||
| align="right" |'''题目类型'''|| || '''文字分析''' | | align="right" |'''题目类型'''|| || '''文字分析''' | ||
| 第75行: | 第75行: | ||
| align="right" valign="top" width="100px" |'''解答要点'''|| || ● trade对应GDP中net exports的情况。当trade存在deficit时,NX小于0,real GDP下降;存在surplus时,NX大于0,real GDP上升。二者可能是正相关关系。 | | align="right" valign="top" width="100px" |'''解答要点'''|| || ● trade对应GDP中net exports的情况。当trade存在deficit时,NX小于0,real GDP下降;存在surplus时,NX大于0,real GDP上升。二者可能是正相关关系。 | ||
|- | |- | ||
| align="right" valign="top" |'''官方答案'''|| ||[[File:9708-2023-specimen-paper-2_1bi-MS.png| | | align="right" valign="top" |'''官方答案'''|| ||[[File:9708-2023-specimen-paper-2_1bi-MS.png|600px]] | ||
|- | |- | ||
| align="right" valign="top" |'''文字版备查'''|| ||<small>(b) (i) Explain the relationship you would expect between the annual change in the balance of trade in goods and services and the annual change in real GDP growth. [2]</small> | | align="right" valign="top" |'''文字版备查'''|| ||<small>(b) (i) Explain the relationship you would expect between the annual change in the balance of trade in goods and services and the annual change in real GDP growth. [2]</small> | ||
| 第83行: | 第83行: | ||
{| | {| | ||
|- | |- | ||
| align="right" valign="top" |'''题目1bii'''|| || [[File:9708-2023-specimen-paper-2_1bii.png| | | align="right" valign="top" |'''题目1bii'''|| || [[File:9708-2023-specimen-paper-2_1bii.png|800px]] | ||
|- | |- | ||
| align="right" |'''题目类型'''|| || '''图表分析''' | | align="right" |'''题目类型'''|| || '''图表分析''' | ||
| 第93行: | 第93行: | ||
| align="right" valign="top" width="100px" |'''解答要点'''|| || ● 去表格中寻找并描述在发生deficit和surplus时,GDP的变化情况。发现某些时期确实符合上述正相关关系,但也有时不符合。<br/>● 分别将符合时段和不符合时段进行列举,说明关系并非完全吻合。 | | align="right" valign="top" width="100px" |'''解答要点'''|| || ● 去表格中寻找并描述在发生deficit和surplus时,GDP的变化情况。发现某些时期确实符合上述正相关关系,但也有时不符合。<br/>● 分别将符合时段和不符合时段进行列举,说明关系并非完全吻合。 | ||
|- | |- | ||
| align="right" valign="top" |'''官方答案'''|| ||[[File:9708-2023-specimen-paper-2_1bii-MS.png| | | align="right" valign="top" |'''官方答案'''|| ||[[File:9708-2023-specimen-paper-2_1bii-MS.png|600px]] | ||
|- | |- | ||
| align="right" valign="top" |'''文字版备查'''|| ||<small>(ii) Consider the extent to which this relationship is evident in the data in Table 1.1. [2]</small> | | align="right" valign="top" |'''文字版备查'''|| ||<small>(ii) Consider the extent to which this relationship is evident in the data in Table 1.1. [2]</small> | ||
| 第101行: | 第101行: | ||
{| | {| | ||
|- | |- | ||
| align="right" valign="top" |'''题目1c'''|| || [[File:9708-2023-specimen-paper-2_1c.png| | | align="right" valign="top" |'''题目1c'''|| || [[File:9708-2023-specimen-paper-2_1c.png|800px]] | ||
|- | |- | ||
| align="right" |'''题目类型'''|| || '''文字分析''' | | align="right" |'''题目类型'''|| || '''文字分析''' | ||
| 第111行: | 第111行: | ||
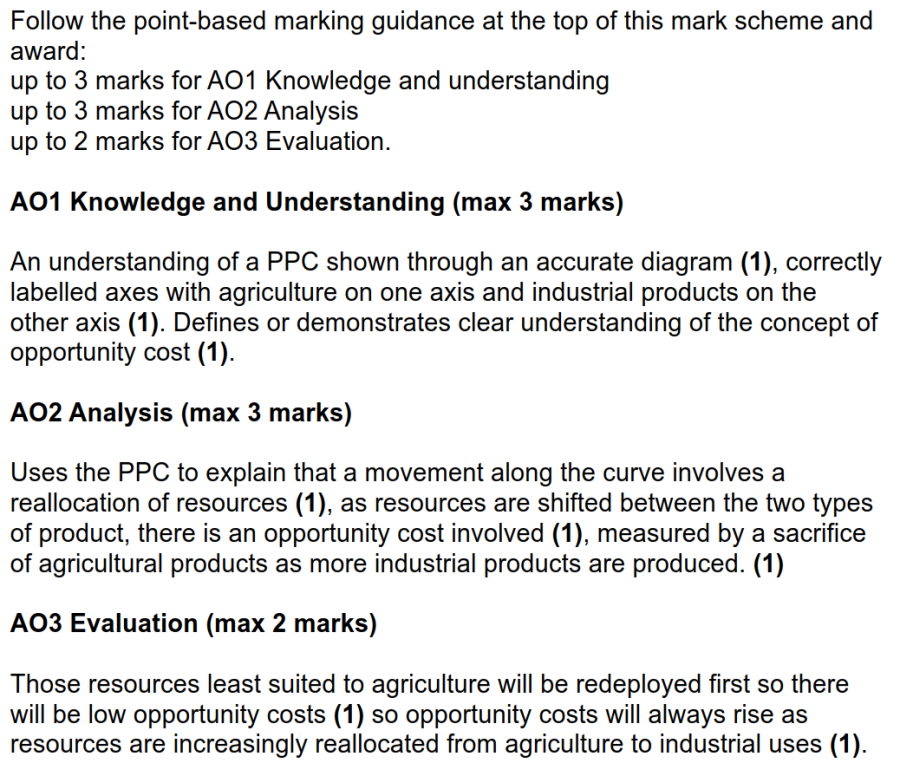
| align="right" valign="top" width="100px" |'''解答要点'''|| || ● 注意选取一个aggregate supply方面的影响因素,比如基础设施的建设(学校、公路等)。<br/>● 说明该政策与经济增长之间的联系逻辑链。比如建设学校可以提供更好的教育,人们的技能提升,生产效率提升,output增加,经济增长。 | | align="right" valign="top" width="100px" |'''解答要点'''|| || ● 注意选取一个aggregate supply方面的影响因素,比如基础设施的建设(学校、公路等)。<br/>● 说明该政策与经济增长之间的联系逻辑链。比如建设学校可以提供更好的教育,人们的技能提升,生产效率提升,output增加,经济增长。 | ||
|- | |- | ||
| align="right" valign="top" |'''官方答案'''|| ||[[File:9708-2023-specimen-paper-2_1c-MS.png| | | align="right" valign="top" |'''官方答案'''|| ||[[File:9708-2023-specimen-paper-2_1c-MS.png|600px]] | ||
|- | |- | ||
| align="right" valign="top" |'''文字版备查'''|| ||<small>(c) Using the information provided, explain one supply-side reason why Vietnam has experienced ‘spectacular economic growth’. [2]</small> | | align="right" valign="top" |'''文字版备查'''|| ||<small>(c) Using the information provided, explain one supply-side reason why Vietnam has experienced ‘spectacular economic growth’. [2]</small> | ||
| 第119行: | 第119行: | ||
{| | {| | ||
|- | |- | ||
| align="right" valign="top" |'''题目1d'''|| || [[File:9708-2023-specimen-paper-2_1d.png| | | align="right" valign="top" |'''题目1d'''|| || [[File:9708-2023-specimen-paper-2_1d.png|800px]] | ||
|- | |- | ||
| align="right" |'''题目类型'''|| || '''观点讨论''' | | align="right" |'''题目类型'''|| || '''观点讨论''' | ||
| 第129行: | 第129行: | ||
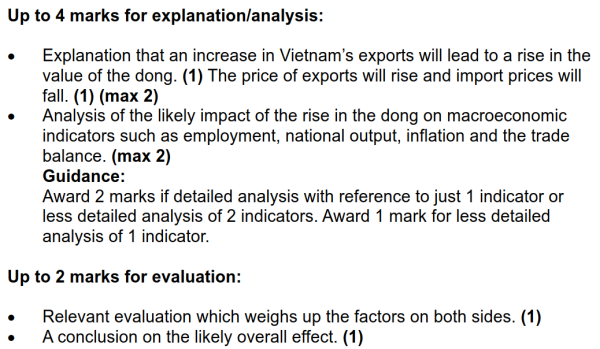
| align="right" valign="top" width="100px" |'''解答要点'''|| || ● 首先解释题干中提到的各类概念。<br/>● 然后讨论出口增加为什么会导致汇率升值,说明二者之间的逻辑链。<br/>● 接着讨论货币升值带来的好处,点明影响,说明汇率与影响之间的逻辑链,比如进口原材料便宜,cost-push inflation下降等。<br/>● 之后讨论货币升值带来的坏处,点明影响,说明汇率与影响之间的逻辑链,比如增加trade deficit。<br/>● 最后做出总结。 | | align="right" valign="top" width="100px" |'''解答要点'''|| || ● 首先解释题干中提到的各类概念。<br/>● 然后讨论出口增加为什么会导致汇率升值,说明二者之间的逻辑链。<br/>● 接着讨论货币升值带来的好处,点明影响,说明汇率与影响之间的逻辑链,比如进口原材料便宜,cost-push inflation下降等。<br/>● 之后讨论货币升值带来的坏处,点明影响,说明汇率与影响之间的逻辑链,比如增加trade deficit。<br/>● 最后做出总结。 | ||
|- | |- | ||
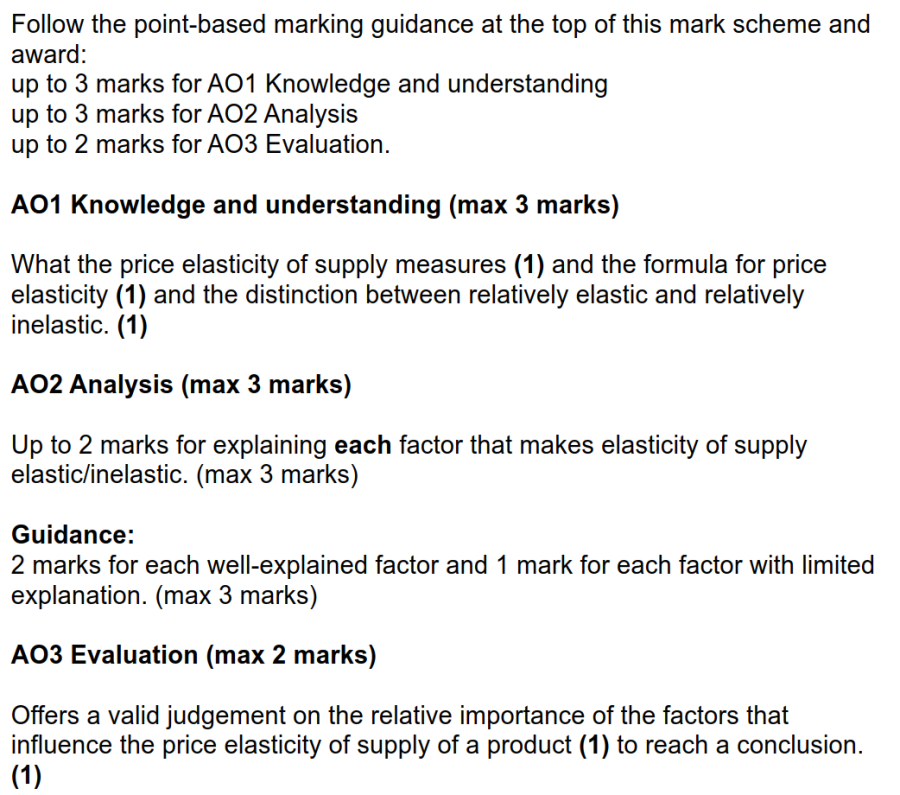
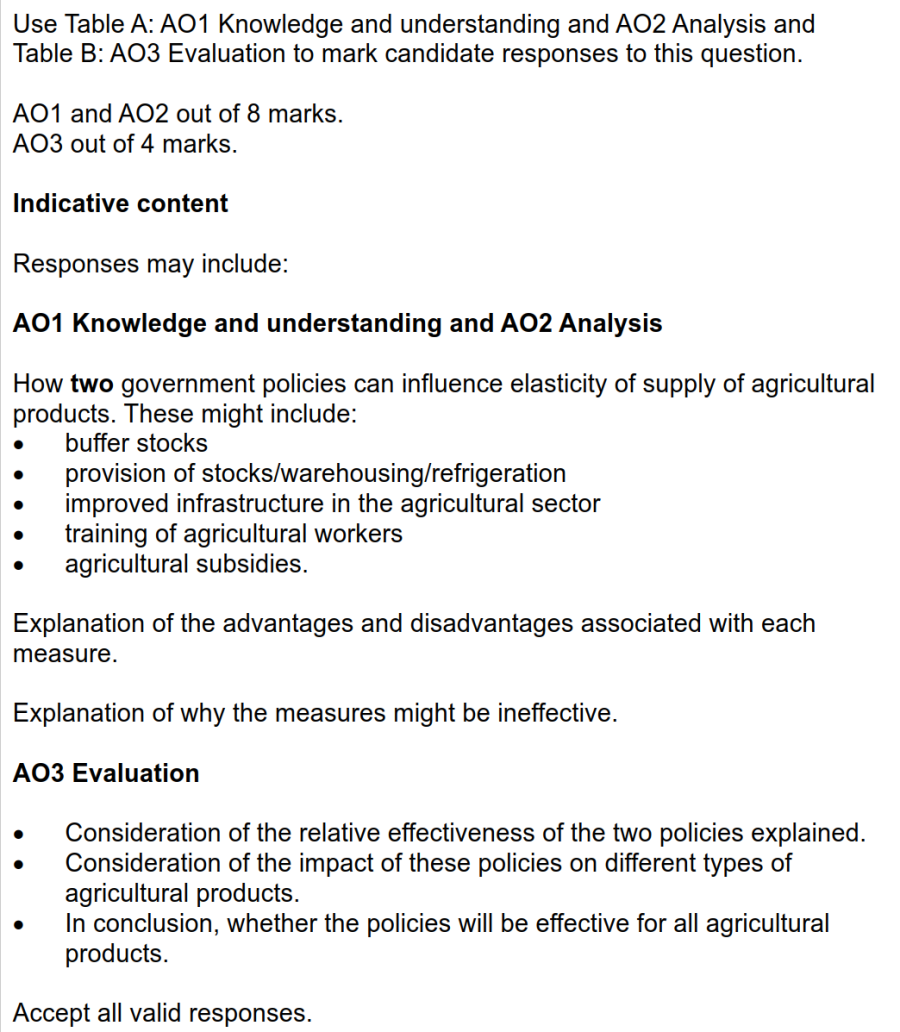
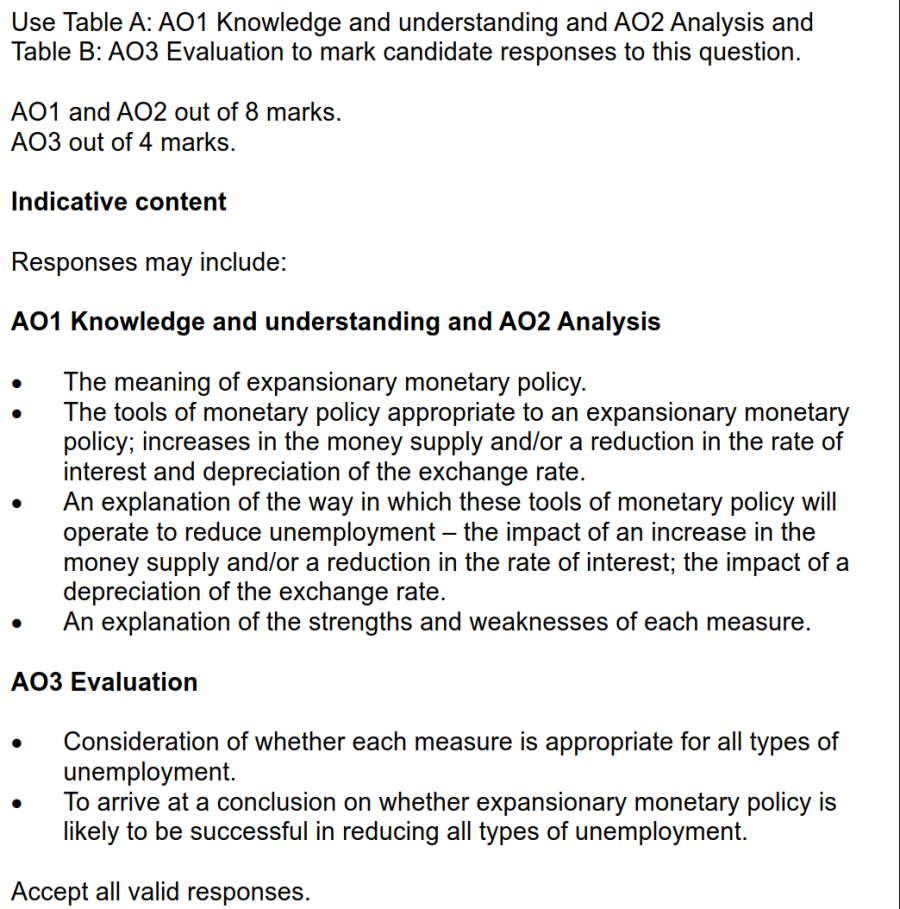
| align="right" valign="top" |'''官方答案'''|| ||[[File:9708-2023-specimen-paper-2_1d-MS.png| | | align="right" valign="top" |'''官方答案'''|| ||[[File:9708-2023-specimen-paper-2_1d-MS.png|600px]] | ||
|- | |- | ||
| align="right" valign="top" |'''文字版备查'''|| ||<small>(d) Assess the likely macroeconomic effects of pressure on the exchange rate of the Vietnamese dong arising from Vietnam’s increased exports. [6]</small> | | align="right" valign="top" |'''文字版备查'''|| ||<small>(d) Assess the likely macroeconomic effects of pressure on the exchange rate of the Vietnamese dong arising from Vietnam’s increased exports. [6]</small> | ||
| 第137行: | 第137行: | ||
{| | {| | ||
|- | |- | ||
| align="right" valign="top" |'''题目1e'''|| || [[File:9708-2023-specimen-paper-2_1e.png| | | align="right" valign="top" |'''题目1e'''|| || [[File:9708-2023-specimen-paper-2_1e.png|800px]] | ||
|- | |- | ||
| align="right" |'''题目类型'''|| || '''观点讨论''' | | align="right" |'''题目类型'''|| || '''观点讨论''' | ||
| 第147行: | 第147行: | ||
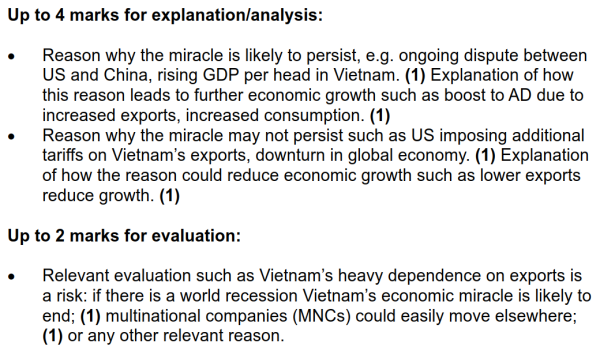
| align="right" valign="top" width="100px" |'''解答要点'''|| || ● 先讨论越南经济可持续的原因,点明原因并说明该原因和经济持续增长的关系。比如基础设施的完善、经济提升并进行capital投资、中美贸易摩擦等。<br/>● 再讨论越南经济可能难以持续的原因,比如美国要收关税、全球经济下滑等。<br/>● 最后给出个人的主观判断,并陈述下判断的理由或讨论上述情况是否发生取决于什么。比如越南过于依赖出口这点很危险、越南公司是否会转移、越南政府的政策等。 | | align="right" valign="top" width="100px" |'''解答要点'''|| || ● 先讨论越南经济可持续的原因,点明原因并说明该原因和经济持续增长的关系。比如基础设施的完善、经济提升并进行capital投资、中美贸易摩擦等。<br/>● 再讨论越南经济可能难以持续的原因,比如美国要收关税、全球经济下滑等。<br/>● 最后给出个人的主观判断,并陈述下判断的理由或讨论上述情况是否发生取决于什么。比如越南过于依赖出口这点很危险、越南公司是否会转移、越南政府的政策等。 | ||
|- | |- | ||
| align="right" valign="top" |'''官方答案'''|| ||[[File:9708-2023-specimen-paper-2_1e-MS.png| | | align="right" valign="top" |'''官方答案'''|| ||[[File:9708-2023-specimen-paper-2_1e-MS.png|600px]] | ||
|- | |- | ||
| align="right" valign="top" |'''文字版备查'''|| ||<small>(e) Assess whether Vietnam’s ‘economic miracle’ is likely to persist over the next few years. [6]</small> | | align="right" valign="top" |'''文字版备查'''|| ||<small>(e) Assess whether Vietnam’s ‘economic miracle’ is likely to persist over the next few years. [6]</small> | ||
2022年8月12日 (五) 01:32的版本
整卷下载
- 试卷请点击此处 ⇒ 【2023 Specimen Paper 2】
- 答案请点击此处 ⇒ 【2023 Specimen Paper 2 Mark Scheme】
关于难度分类的说明:
容易 :概念类、识别类、公式计算类
中等 :原因分析类、影响分析类、图像分析类、计算分析类
困难 :全新概念类、全新场景类、全新图像类、推导复杂类、观点评价类、对比评价类、政策评价类
Data response
中英对照
| 原文 | 参考译文(谷歌机翻) |
|---|---|
| Vietnam's ‘Economic Miracle’ Thirty years ago, Vietnam was one of the poorest countries in Southeast Asia. Since then, its real GDP has increased rapidly. A series of economic and political reforms has been responsible for its so-called ‘economic miracle’. |
越南的“经济奇迹”
|
Essay - Micro微观
Essay - Macro宏观


